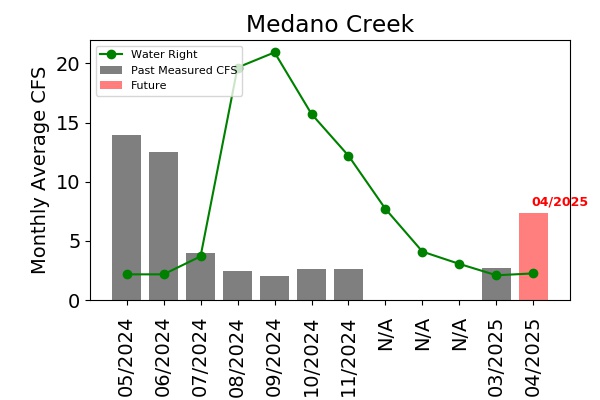
ABOVE: Stream prediction Gray bars = Monthly average Measured flow in Cubic Feet per Second (CFS) from the gage located here. Red Bar = Future flow estimates made with a model that uses data from the Medano Pass Snotel weather station located here. There are no forecasts for December, January, and February.
RIGHT: Fire Forecast showing the percent of historic fires that have ignited when conditions are as dry as today. Description of forecast methods: in this article. DASHED LINES show future forecasts. BACKGROUND COLORS (green, yellow, orange, red) indicate fire risk.
The Keetch-Byram Drought Index (KBDI) measures the likelihood of fire spread based on the moisture content of deep soil and duff layers. It ranges from 0 (no drought) to 800 (extreme drought) and is based on an assumed soil water holding capacity of 8 inches (800 hundreths of an inch) of water. The depth of soil required to hold 8 inches of moisture varies. A KBDI of 300, for example, indicates that 3 inches (300 hundreths of an inch) of precipitation would be required to restore soil to full water holding capacity. The KBDI shown in the graph to the right was calculated using methods described here and here.
Thousand Hour Fuel Moisture (THRFM) is the percent moisture content, by weight, of dead wood 3 - 8 inches in diameter. THRFM can be determined empirically by weighing pre-prepared wood samples in the field. The THRFM shown in the graph to the right is estimated by applying a mathematical algorithm to weather data collected in Great Sand Dunes National Park (37.7266N, 105.51083W). Even though the estimates in the graph are not derived empirically, they compare quite well to actual field measurements as shown in this graph. The equations used to estimate THRFM are described here and here.